Complexity and systems
This topic holds the method itself: how to see a system you live inside, from coherent complexity and domain cartography to loops and legibility.
You cannot simplify a complex system, but you can make it visible.
Start with these
- Making Complexity Visible: You Cannot Simplify the Ocean, Only Chart It
When a system is hard to see, decisions migrate to whoever holds the context. You cannot simplify the ocean, only chart it: why a live view of a system widens the circle of people who can think about it.
- Complexence
Complexity is the condition of the world. Complexence is the quality you bring to it: the capability of standing inside a system larger than yourself, seeing it whole, and still choosing. A word for the thing all my work has been about.
- How to Live Coherently Inside Complex Systems
Coherent complexity is what you get when a complex system is made legible without being made simple. You do not reduce it. You map it, until you can move through it on purpose. A field guide to the practice, and the idea behind everything else I build.
- Domain Cartography
Domain cartography is the practice of charting a complex domain you have to live and act inside, until it is legible enough to navigate. Not making it simple. Making it readable. Here is the field, the method, and the six layers every map needs.
- How to Map a Domain: The Six Layers
The hardest part of mapping a complex domain is the blank page. Here are the six layers I run every domain through, from primitives to levels, with the question each one answers, how to actually do it, and the failure mode that shows up when you skip it.
Series
- Loops and Legibility 8 parts
- Reading the Cybernetics Canon 4 parts
Where it leads
Look around


Everything in Complexity and systems (20)
Essays (15)
- The Rest of the Map Oct 2026
- The Hacker Ethic Meets Cybernetics Oct 2026
- Gentler On-Ramps to Cybernetics Oct 2026
- A Map Before the Reading Oct 2026
- A Cybernetics Reading List, Written Before I Read It Oct 2026
- Culture Is the Oldest Information Technology Oct 2026
- A Loop Is a Path That Closes Oct 2026
- Knowing Isn't a System Jul 2026
- Finding Edgar Morin Jul 2026
- The Little Black Book of Hansuru Jul 2026
- Why Thirty-Three Repositories Needed a Census Jun 2026
- How to Map a Domain: The Six Layers Jun 2026
- Domain Cartography Jun 2026
- Complexence Jun 2026
- How to Live Coherently Inside Complex Systems Jun 2026
Freewriting (5)
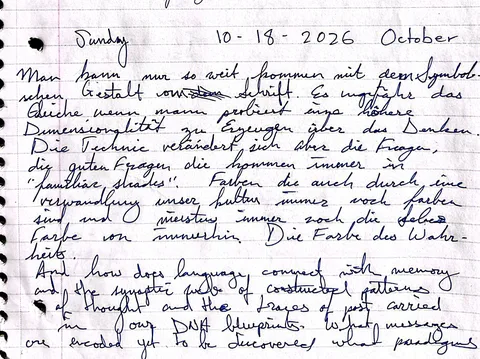
- Arguing and Agreeing Oct 2026
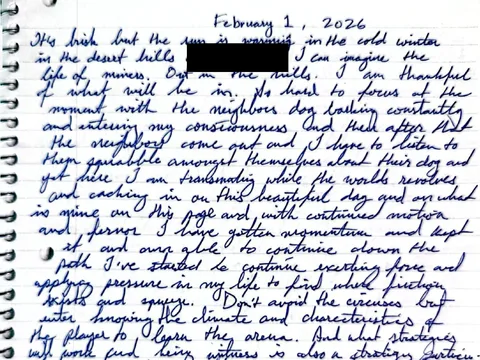
- Where the Wind Is Blowing From Feb 2026
- A Hug From the Universe Feb 2026
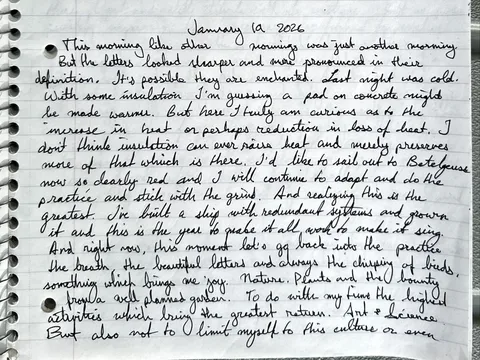
- Aboard a Planet Hurtling Through Space Jan 2026
- Ice Builds in the Shadows Jan 2026
The frameworks
Charts for complex things, each a map of one domain, all of them serving the same idea: make the system legible enough to move inside without pretending it is small.
- People of the Stars
Time made legible: knowing what kind of day you are standing in, so you place the right work in the right moment.
- The Decan Log
A ten-day calendar for conscious living: a chart for a year, decan by decan.
- Situational Governance
Power made legible: route a situation to the arena it is actually in. One constitution, many arenas, bounded risk.
- Hansuru
Uncertainty made legible: an operating system for markets and the body. Partial action, bounded risk, survival first.
- The Science of Complexence
The foundation under the capability: how meaning moves through a system, and what shape it takes when it does.
- Complexence OS
The capability made operational: talk into a file, let a chief of staff route the work, review only the exceptions.
- AWS Is Math, Kubernetes Is Physics
The grand and the granular, held in one view: a map for two ways of reasoning about infrastructure.